


What data and metrics are included in INRIX Roadway Analytics?
Speed Related Data
-
Speed - estimated harmonic mean speed
-
Historic Average Speed - historical average speed for that hour of the day and day of the week
-
Reference Speed - the free flow speed
Travel Time Related Metrics
-
Travel Time - estimated harmonic mean speed
-
Travel Time Index - average travel time represented as a percentage of the ideal (free-flow) travel time (a measure of average congestion)
Performance Related Metrics
-
Buffer Time - extra time (or time cushion) that a traveler must add to the average travel time to ensure an on-time arrival
-
Buffer Time Index - buffer time represented as a percentage of the average travel time
-
Planning Time - total time that a traveler should plan for to ensure an on-time arrival
-
Planning Time Index - planning time represented as a percentage of the ideal (free-flow) travel time
Missing Data
The following dates have missing data because of processing issues: |Date|Missing Data| |—|—| |2014-02-13, 2014-03-13, 2014-04-13|Speeds| |2014-05-01 to 2014-05-02|Speeds (Non-NA Only is Missing)| |2020-03-28 to 2020-03-29|Speeds, Incidents, Bottlenecks| |2020-03-30 to 2020-04-02|Bottlenecks| |2020-05-16 to 2020-06-18|Bottlenecks (DC,FL,GA,MD,NY,NC,OH,PA,SC,VA,WV)|
How is the speed metric calculated?
For each road segment in a corridor, the speed is calculated by computing the harmonic mean of all of the relevant speed values from the historical data archive. That is, if a study is examining a five-day period at a granularity of one hour, the road segment speed for each one-hour period will be an average of 300 speed values (one speed value per minute * 60-minute window * 5-day study period).
There are three types of Pythagorean means arithmetic, harmonic, and geometric. While the arithmetic mean is the most common (the sum of the values divided by the number of values), the other means are more accurate in certain situations.
When calculating a mean involving rates or speeds, the most accurate mean to use is the harmonic mean. The harmonic mean is defined as the reciprocal of the arithmetic mean of the reciprocals, which simplifies to the number of values divided by the sum of the reciprocals of the values.
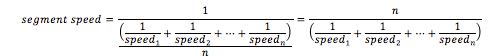
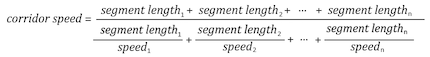
The speed metric for the entire corridor is calculated from the individual segment speeds weighted by the segment lengths, as follows:
How is the historic average speed metric calculated?
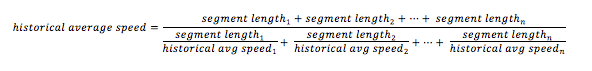
For each road segment in a corridor, the historic average speed is calculated for each hour of the day and day of the week by computing the harmonic mean of the relevant historic average speed values.
The historical average speed metric for the entire corridor is calculated as a weighted harmonic mean using the individual segment speeds and segment lengths, as follows:
How is the travel time metric calculated?
For each road segment in a corridor, the travel time is simply the segment length divided by the segment speed.

The travel time metric for the entire corridor is calculated as the sum of the travel times for all of the segments in the corridor.

How is the travel time index metric calculated?
For each road segment in a corridor, the travel time index is calculated as the travel time for the segment divided by the ideal (free-flow) travel time for that segment, where the free-flow speed is equal to the reference speed.
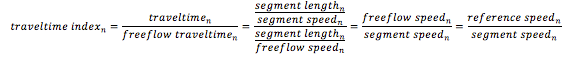
The travel time index metric for the entire corridor is calculated as the travel time for the corridor divided by the ideal (free-flow) travel time for corridor, where the free-flow travel time is the sum of the free-flow travel times for all of the segments in the corridor and the free-flow speed is equal to the reference speed.

How is the buffer time metric calculated?
The buffer time metric uses the concept of the 95th percentile travel time, which represents the travel time to be expected on the worst day of any month. That is, 19 out of 20 work days in any month (or 95% of the days) will have shorter travel times than the 95th percentile travel time. The buffer time is the extra time that a traveler must add to the average travel time to ensure an on-time arrival.
The buffer time metric is calculated as follows:

How is the planning time metric calculated?
The planning time metric uses the concept of the 95th percentile travel time, which represents the travel time to be expected on the worst day of any month. That is, 19 out of 20 work days in any month (or 95% of the days) will have shorter travel times than the 95th percentile travel time. The planning time is the total time that a traveler should plan to ensure an on-time arrival and reflects worse case conditions on a corridor.
The planning time metric is calculated as follows:

How is the planning time index metric calculated?
The planning time index metric relates the planning time to the ideal (free-flow) travel time. It can be directly compared to the travel time index, to illustrate the differences between average conditions and worse case conditions.
For each road segment in a corridor, the planning time index is simply the 95th percentile travel time for the segment divided by the ideal (free-flow) travel time for that segment, where the free-flow speed is equal to the reference speed.
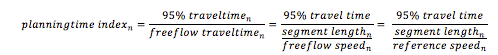
The planning time index metric for the entire corridor is calculated as the 95th percentile travel time for the corridor divided by the ideal (free-flow) travel time for corridor, where the free-flow travel time is the sum of the free-flow travel times for all of the segments in the corridor and the free-flow speed is equal to the reference speed.

INRIX Roadway Analytics Bottlenecks
How are bottlenecks defined?
The detection of bottlenecks is based on comparisons of speeds to reference speeds, which are the proxy of the free flow or uncongested speed. A potential bottleneck is detected when speeds on a segment drop to 65% of the reference speed, and a bottleneck is published if speeds stay below 65% and causes 120 seconds of delay. As long as the speed remains below 75% of the reference speed, the bottleneck will not be cleared.
Although bottleneck locations are associated with INRIX XD Segments, computations to detect bottlenecks are actually based on finer resolution sub-segments, and the reported length of a bottleneck is the sum of all of the affected sub-segments. The mapped location of the bottleneck provides the associate XD segments as well as the precise start and end of the bottleneck.
Are versions of the same bottleneck identified and tracked?
Bottleneck versions are continuously tracked, and the average duration, average maximum length, and number of occurrences of all versions of a single bottleneck are tabulated.
How are bottlenecks ranked?
Using the tabulated bottleneck statistics, bottlenecks can be ranked based on their Prioritization Factor, which is defined as durationlengthoccurrences.