


Where does INRIX data come from?
When INRIX was founded nearly a decade ago, drivers and departments of transportation relied primarily on sensor and camera networks on a limited number of roads to understand real-time traffic conditions. This approach was expensive to install and maintain, and only covered a few roads. INRIX took a different approach, revolutionizing how traffic information was created by collecting and aggregating data from a number of sources, including the vehicle that travel the roadway and other mobile devices.
Today, INRIX operates the most robust driver network in the world that includes 275 million vehicles (including commercial fleets, delivery and taxi vehicles, as well as consumer vehicles), smartphones, cameras, incidents and other sensors with the ability to cover nearly 8 million kilometers (5 million miles) of road, ramp and interchange in over 40 countries.
The extent and diversity of sources contributes to the richness of the INRIX XD Archive and ensure that coverage is available and accurate in different situations, at many locations, for a variety of road types, and during any time of day.
What kind of data does INRIX collect?
INRIX combines anonymous, real-time GPS probe data with traditional real-time traffic flow information and hundreds of market-specific criteria that affect traffic - such as construction and road closures, real-time incidents, sporting and entertainment events, weather forecasts and school schedules – to provide the most accurate picture of current flows.
Probe data may consist of location, time, speed, heading, and possibly additional metadata that provides context for the vehicle’s current status. All INRIX probe data is collected continuously in real time and is extensively validated to ensure that only the highest quality data is utilized in producing INRIX data products.
What is the extent of the INRIX historical speed data archive?
Segment level traffic values are computed by INRIX using its proprietary processes are archived and available to support historical analyses. INRIX Roadway Analytics is based on the INRIX XD Traffic archive with data starting January 1, 2014.
What measures does INRIX take to ensure data privacy?
INRIX takes data privacy extremely seriously. All our data is sourced from providers whose users have opted into an agreement which allows the provider to share their data with us. We enforce a strict policy regarding the anonymization of the data that we receive, including the hashing and rotation of device identifiers.
How is INRIX probe data used to determine speed values on road segments?
Part of INRIX’s proprietary process is the association of probe data with specific road segments, which is called map matching. INRIX’s ability to map match GPS observations is well proven. It has been in use since 2006 and is currently producing real-time traffic data with updates each minute for locations around the world, a process that involves the map matching of billions of GPS observations each day in real time.
Once accurately matched, data points can be used to calculate traffic values for road segments. INRIX utilizes a broad combination of proprietary numerical and statistical algorithms to aggregate and accurately combine data from all of its sources in order to provide highly accurate traffic information with very little latency. The results are a rich archive of minute by minute historical speed values that provide the foundational data set from which INRIX Roadway Analytics is built.
What road segment definitions does INRIX use?
Introduced in January 2014, XD Segments mark a key upgrade for INRIX and its customers. While similar to standard TMC segments in that they delineate a specific section of roadway, XD Segments are defined and maintained by INRIX, ensuring the ability to cover new roads more quickly. XD Segments allow INRIX to provide road coverage for every major road type and class from highways, ramps and interchanges to arterials, city streets and other secondary roads – twice as many roads compared to what had previously been available.
What traffic values are available for each road segment?
INRIX employs advanced algorithms to compute a measured speed on roadways every minute. For each road segment, INRIX calculates the current speed, the historical average speed (the typical speed for the current day of week and hour of day in 15 minute increments), and the reference speed (the proxy of the free flow or uncongested speed, defined for the entire day). The speed is then used to calculate the travel time required to cross the segment.
A score is also provided to indicate the source of the speed data returned. Specifically, the score indicates whether the speed was calculated from:
-
Measured speed value for minute-level data (Score 30)
-
Historical data profile (Score 20)
-
Reference speed (Score 10)
For cases where the score indicates minute-level data, a measure of the confidence in that data (called the c-value) is included. The c-value range is 0-100, with 100 representing the highest confidence. Confidence is based on a model that considers current data density, as well as data consistency when compared to mid-term observations and long-term (historical) expectations
What happens when road segments are updated or changed?
As part of INRIX’s internal map update process (every six months), INRIX XD Segments are updated leading to the addition of new road segments or changes in existing segment definitions. To request the addition of a new road or any adjustments, please do so by sending feedback.
In INRIX Roadway Analytics, when viewing and analyzing historic data that spans a time period encompassing multiple map versions, algorithms are automatically implemented to calculate traffic values that correctly account for any differences in road segments and associated corridors whenever it is feasible and logical to do so.
What is the typical length of individual XD segments?
XD Segments range in length between 10m and 1600m. Segment length will vary depending upon many factors including road hierarchy and the number of junctions on the stretch of road.
Here is the percentage of road segments by length:
| XD Segment Length | Percentage of Total |
|---|---|
| Less than 100 Meters | 22% |
| Between 100 and 500 Meters | 19% |
| Between 501 and 1000 Meters | 38% |
| Between 1001 and 1600 Meters | 21% |
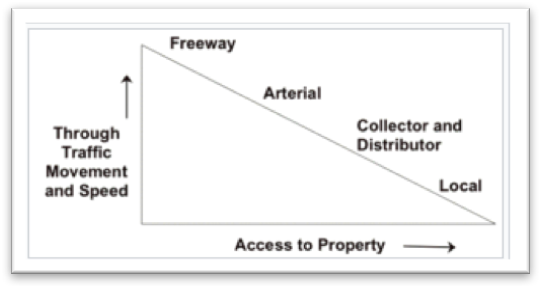
What does FRC stand for?
FRC stands for ‘functional road classification.’ |Classification|Example| |—|—| |FRC 1|National Interstates| |FRC 2|Regional Highways, Expressways| |FRC 3|Arterials| |FRC 4|Collector Roads| |FRC 5|Local Roads|
How do INRIX XD road segments differ from TMC segments?
TMC location codes specify points on a road network, typically assigned at significant decision points, interchanges or intersections for describing locations of traffic incidents (accidents, construction, traffic slowdowns, etc.) in an unambiguous format, independent of map vendor. TMC segments are defined as the road segments between consecutive TMC location codes. Thus, TMCs provide a set of standard locations for the market, certified by an industry agency, that enable location coding in key geographies. In addition, map data often includes TMCs to enable easy decoding.
However, TMCs have significant challenges that limit their value. For instance, TMCs are not encoded for all countries and geographies, and even when TMCs are available in a region, they may not cover all traffic impacted roads. Updates to TMC definitions often lag a year or more behind the completion of new bridges, interchanges and other roads. TMCs are also not relevant for users without an encoded map. In addition, as the quality of traffic data has improved, the granularity that TMCs provide is often not sufficient to adequately reflect all the available information.
INRIX XD also offers better granularity than TMC, delivering average segment lengths of 800 meters (.5 miles) compared to typical TMC resolutions of 2-5 kilometers (1-3 miles). INRIX XD also supports a broad range of dynamic location referencing methods, including AGORA-C and OpenLR.
For corridors where road and rail follow a similar route (e.g. A1 and East Coast main line) is the data able to effectively filter out the rail trips?
We undertake the mode filtering referred to in the above response regarding walking and cycling. Additionally, the processing we use to snap the raw GPS points to our road segmentation considers the entire trajectory of each trip, not just each location record in isolation. This further reduces the risk of non-highway modes polluting the dataset. If you are concerned about this issue for a specific study, we recommend you contact our sales team with details of the opportunity and we can arrange for a sample dataset to be created for your area of interest.
When defining a route, can you add ‘via’ points, or does the system just define a most direct route between an A and B?
You can define routes by selecting multiple ‘via’ points to guide the route definition.
Can you look at data split by vehicle class e.g. to look at freighter truck speeds?
We currently provide a single speed estimate per segment. There is no differentiation by vehicle type.
Does the product have a future predictability feature based on past data?
We do not currently create long-term speed forecasts for segments or routes. We do use historical speed information as part of our processing for when our volumes of real-time data are insufficient to confidently produce a real-time speed publication.
Do people using mobile phone while cycling or walking skew speed value results?
Our speeds are derived from GPS location data only. We do receive GPS data from navigational applications used on mobile phones. Our processing of the raw GPS data includes filtering methods to clean the data for its intended use. In short, we are confident that our speed calculations are not polluted by data from non-highway modes of transport.