


Terminology
| Term | Definition |
|---|---|
| Intersection | An intersection is a junction between two or more roadways |
| Approach | The direction of travel for , e.g., Eastbound/Westbound/Southbound or Northbound |
| Movement | A movement is a stretch of road that represents a vehicle maneuver through an intersection. This includes left turn, thru, and right turn movements. |
| Observed vs. Scaled | Count of observed vehicle probe data vs. a scaled estimate of all vehicles |
| Corridor | A segment of roadway that includes signalized intersections |
Dashboard Performance Measure Definitions
| Metric | Definition |
|---|---|
| Intersections | The number of intersections an agency has active and under license in the platform. |
| Approaches | The number of approaches an agency has active and under license in the platform. |
| Movements | The number of movements an agency has active and under license in the platform. |
| Corridors | The number of corridors an agency has active and under license in the platform. |
| Total Control Delay | The estimated scaled control delay of all intersections in the network. This is compared to the 4-week historic average. |
| Average Control Delay per Vehicle | The average control delay across all intersections in the network. This is compared to the 4-week historic average. |
| Worsened Control Delay (Total) | The estimated scaled control delay at the 5 most worsened intersections compared to their 4-week historic average. |
| Worsened Control Delay (Per Vehicle) | The average control delay at the 5 most worsened intersections compared to their 4-week historic average. |
| Worsened Travel Times | The average travel time of the three most worsened corridors compared to their 4-week historic average |
| Worsened Travel Time Index | The travel time index of the three most worsened corridors compared to their 4-week historic average. |
Intersection Performance Measure Definitions
List View Performance Measures:
| Metric | Definition |
|---|---|
| Intersection | The name of the intersection |
| ID | A unique identifier for the intersection based on the latitude and longitude |
| POG | Percent Arrival on Green = (( # of total observed vehicles – # of observed stopped vehicles) / # of total observed vehicles) * 100 |
| Total Count | The total observed number of vehicles that performed a specified movement or traveled through an intersection. |
| Through Count | The total observed number of vehicles that performed a specified movement and did not stop. The assumption for a stopped vehicle is a speed below 6 mph (or 10 kph). |
| Stop Count | The observed number of stopped vehicles for a movement or intersection. The assumption for a stopped vehicle is a speed below 6 mph (or 10 kph). |
| Split Count | The number of occurrences of split failures experienced by all vehicles on a particular movement; a split failure occurs where green signal time fails to meet the vehicle volume demand and a driver is forced to stop more than once at a traffic signal |
| Split % | The percentage of split failure counts relative to the total observed vehicle count |
| Control Avg | The difference between the actual travel time for a vehicle to move through the intersection vs. the reference travel time; the reference travel time is calculated as the 5th percentile of travel times for non-queued vehicle movements through the intersection. For example, if a vehicle took 30 seconds to move through the intersection and the reference travel time was 10 seconds, the control delay would be 20 seconds. The average value is presented. |
| Travel Time | The total time it takes for a vehicle to travel the length of a movement. The average value is presented. |
Map View – Intersection Display Performance Measures:
| Metric | Definition |
|---|---|
| Change in LOS | The number of levels an intersection has changed in LOS compared to a historic 4-week average. Green represents an improvement, while a red represents a degradation. The LOS is measured based on one of three performance metrics. |
| LOS Values | A visual representation of LOS on the map. Green represents better-performing intersections, while red represents worse-performing intersections. A legend in the lower-left corner explains the ranges for the colors. |
| Avg. Control Delay/Vehicle | A qualitative measure of LOS describing operational conditions within a traffic stream, which is standard in traffic engineering, defined as: |
| Percent on Green | A qualitative measure of LOS describing operational conditions at an intersection, specifically progression, defined as: |
| Split Failures | A qualitative measure of LOS describing operational conditions at an intersection, based on the percentage of observed vehicles experiencing a split failure, defined as: |
| Avg. Control Delay/Vehicle | A qualitative measure of LOS describing operational conditions within a traffic stream, which is standard in traffic engineering, defined as: A ≤10 Free Flow B >10 – 20 Stable Flow (slight delays) C >20 – 35 Stable flow (acceptable delays) D >35 – 55 Approaching unstable flow (tolerable delay, occasionally wait through more than one signal cycle before proceeding) E >55 – 80 Unstable flow (intolerable delay) F >80 Forced flow (congested and queues fail to clear) |
| Percent on Green | A qualitative measure of LOS describing operational conditions at an intersection, specifically progression, defined as: A >90% arrival on green (near perfect) B >75 - 90% arrival on green C >55 - 75% arrival on green D >35 - 55% arrival on green E >20 - 35% arrival on green F ≤ 20% arrival on green (very poor) |
| Split Failures | A qualitative measure of LOS describing operational conditions at an intersection, based on the percentage of observed vehicles experiencing a split failure, defined as: A ≤1% less than 1% of observed vehicles experienced a split failure B >1-5% C >5-15% D >15-30% E >30-50% F >50% over half of the observed vehicles experienced a split failure |
Intersection Diagram Performance Metrics:
| Metric | Definition |
|---|---|
| Change in LOS | The number of levels an intersection has changed in LOS compared to a historic 4-week average. Green represents an improvement, while a red represents a degradation. The LOS is measured based on one of three performance metrics. |
| LOS Values | A visual representation of LOS on the map. Green represents better-performing intersections, while red represents worse-performing intersections. A legend in the lower-left corner explains the ranges for the colors. |
| Avg. Control Delay/Vehicle | A qualitative measure of LOS describing operational conditions within a traffic stream, which is standard in traffic engineering, defined as: |
| Percent on Green | A qualitative measure of LOS describing operational conditions at an intersection, specifically progression, defined as: |
| Split Failures | A qualitative measure of LOS describing operational conditions at an intersection, based on the percentage of observed vehicles experiencing a split failure, defined as: |
Movement Detail Performance Metrics:
| Metric | Definition |
|---|---|
| Change in LOS | The number of levels an intersection has changed in LOS compared to a historic 4-week average. Green represents an improvement, while a red represents a degradation. The LOS is measured based on one of three performance metrics. |
| LOS Values | A visual representation of LOS on the map. Green represents better-performing intersections, while red represents worse-performing intersections. A legend in the lower-left corner explains the ranges for the colors. |
| Avg. Control Delay/Vehicle | A qualitative measure of LOS describing operational conditions within a traffic stream, which is standard in traffic engineering, defined as: |
| Percent on Green | A qualitative measure of LOS describing operational conditions at an intersection, specifically progression, defined as: |
| Split Failures | A qualitative measure of LOS describing operational conditions at an intersection, based on the percentage of observed vehicles experiencing a split failure, defined as: |
Corridor Performance Measure Definitions
List View Performance Measures:
| Metric | Definition |
|---|---|
| Name | The user defined name of the corridor. |
| Direction | The cardinal or ordinal direction of the corridor. |
| Length | The length of the corridor in kilometers. |
| Total Vehicles | The total observed number of vehicles that traveled from end to end of the corridor in the selected time period. |
| Avg TT | The average travel time of the vehicles that traveled from end to end of the corridor in the selected time period. |
| 25% TT | The 25th percentile travel time of the vehicles that traveled from end to end of the corridor in the selected time period. |
| Median TT | The 50th percentile travel time of the vehicles that traveled from end to end of the corridor in the selected time period. |
| 75% TT | The 75th percentile travel time of the vehicles that traveled from end to end of the corridor in the selected time period. |
| Planning time | The 95th percentile travel time of the vehicles that traveled from end to end of the corridor in the selected time period. |
| Free Flow Travel Time | The free flow travel time is calculated as the 5th percentile travel time between midnight and 6 AM. |
| TT Index | The average travel time divided by the free flow travel time. |
| Planning TI | The planning time index is the planning time divided by the free flow travel time. |
| LOTTR | The level of travel time reliability is defined as the 80th percentile travel time divided by the median travel time. |
| Start Point | The latitude and longitude of the starting point of the corridor. |
| End Point | The latitude and longitude of the ending point of the corridor. |
Map View – Intersection Display Performance Measures:
| Metric | Definition |
|---|---|
| Travel Time Index | Visual representation of the LOS based on the travel time index. A ≤1.1x the average travel time is less than 10% more than the free flow travel time. B > 1.1 – 1.3x C > 1.3 – 1.5x D > 1.5 – 2.0x E > 2.0 – 2.5x F > 2.5x the average travel time is 2.5 times the free flow travel time. |
| Change in Travel Time Index | The number of levels a corridor has changed in the above travel time index metric compared to a historic 4-week average. Green represents an improvement, while red represents a degradation. |
Corridor Details Performance Metrics:
| Metric | Definition |
|---|---|
| Length | The length of the corridor in kilometers. |
| Free Flow | The free flow travel time is calculated as the 5th percentile travel time between midnight and 6 AM. |
| Vehicle Count | The total observed number of vehicles that traveled from end to end of the corridor in the selected time period. This is compared to the 4-week historic average. Absolute and percent change are also shown. |
| Average Travel Time | The average travel time of the vehicles that traveled from end to end of the corridor in the selected time period. This is compared to the 4-week historic average. Absolute and percent change are also shown. |
| Travel Time Index | The average travel time divided by the free flow travel time of the corridor in the selected time period. This is compared to the 4-week historic average. Absolute and percent change are also shown. |
| Planning Time Index | The planning time index is the planning time divided by the free flow travel time. This is compared to the 4-week historic average. Absolute and percent change are also shown. |
Platform Logic
Data
The data being used are probe trajectory data. These data are collected from connected vehicles and include individual waypoint information every few seconds. The waypoint data allow a vehicle to be traced through an intersection, where valuable insights can be extracted and aggregated to understand and improve the signal performance at an intersection. INRIX Signal Analytics sources data purely from high-quality, high frequency (< 5 seconds) data providers to produce a series of signal performance measures. The metrics collected at the vehicle level are approach speed, travel time, stops, and entering and exiting heading. The data are processed through the INRIX trips engine, then aggregated at the intersection level to provide scalable metrics at every intersection. The corridors feature loosens the 5 second restriction to increase the number of vehicles observed traveling from end to end through a corridor. Frequencies of < 45 seconds are used. Interpolation between points on each side of the start or end point of a corridor provides the basis to determine the travel time for each vehicle.
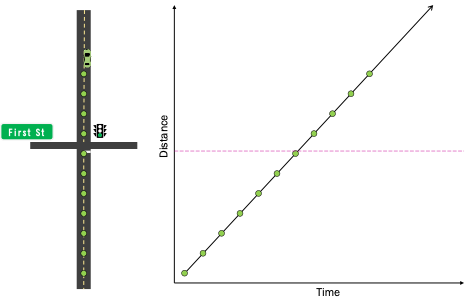
Figure 1. Trajectory Data and Time Space Diagram Example
Metrics
Leveraging the high frequency waypoint data, a vehicle’s journey through the intersection can be characterized. The figure 2 below shows examples of three different trips through the intersection. The green vehicle traveled through the intersection in 12 seconds with a constant speed and no stops. It can logically be assumed that this vehicle arrived at an intersection when the signal was green and experienced little to no delay. The yellow vehicle traveled through the intersection in 32 seconds, and slows to a stop prior to the signalized intersection. This vehicle is assumed to have arrived on a red signal and experienced a minor amount of delay (~20 s) as it made the journey through the intersection. The red vehicle traveled through the intersection in 100 seconds with two observed stops. The vehicle experienced significant delay (~88 s), and because the vehicle had to stop two distinct times, it likely experienced a split failure or had to sit through numerous cycles at the intersection. Logically, these visuals are intuitive, but there are certainly assumptions that need to be made to automate these insights.
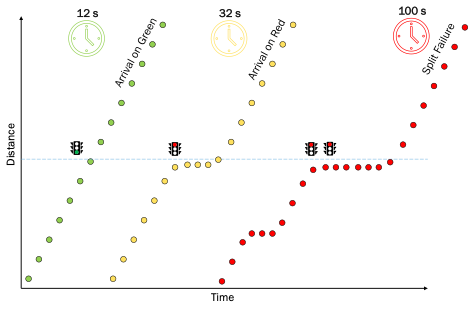
Figure 2. Vehicle Experiences Captured
Assumptions
A series of assumptions were necessary to create performance metrics at the intersection. For each vehicle traveling through the intersection the following assumptions were made:
-
The intersection metrics consider an inbound length of 150 meters (~492 ft) prior to the stop bar and an outbound length of 80 meters (~262 ft) past the stop bar. The inbound length is used to determine if a vehicle stopped prior to the intersection. Both the inbound and outbound lengths are used to determine the travel time of the vehicle through the intersection.
-
A vehicle is considered to have stopped at the intersection if the speed dropped below 10 kph (6.2 mph) for 2 seconds (or one vehicle waypoint) in the inbound length.
-
The reference travel time, used to determine a typical travel time through the intersection, is considered the 5th percentile travel time of all vehicles that did not stop while making the same movement during the selected time period.
The figure 3 below illustrates the assumptions made above. These assumptions allow us to consider every vehicle we observe traveling through an intersection and define the characteristics of that vehicle including:
-
Arrival on Green (AOG) – Arrivals on green represent a vehicle that did not have to stop at a signalized intersection.
-
Travel Time – The time a vehicle takes to travel the inbound and outbound length of the movement.
-
Approach Speed - Maximum speed of a vehicle using waypoint pairs on the inbound length of an intersection.
-
Control Delay - The difference between the actual travel time for a vehicle to move through the intersection versus the reference travel time.
-
Split Failure – A split failure is defined when a vehicle is forced to stop more than once at a traffic signal.
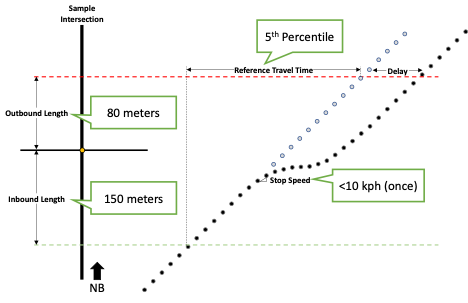
Figure 3. Assumptions for Signal Analytics